Greetings, dear customers! The brand-new Survey Research team here at SurveyMonkey is making its official debut on the blog today, and we couldn’t be more excited to share best practices and tips with all of you. Let’s jump straight in, shall we?
Using SurveyMonkey Audience – a powerful tool for targeting a specific demographic – we recently launched a political survey in seven swing states in the US asking people their opinions on the Affordable Care Act, aka ‘Obamacare’. Each of these states was identified by the non-partisan online newsletter, Cook Political Report, as having competitive state-wide races in the 2014 election year.
We wanted to dig deeper into one of the open-ended questions we asked on the survey and give you the lowdown on how you can make sense of those responses and ensure the quality of your data. After all, smart data leads to even smarter decisions.
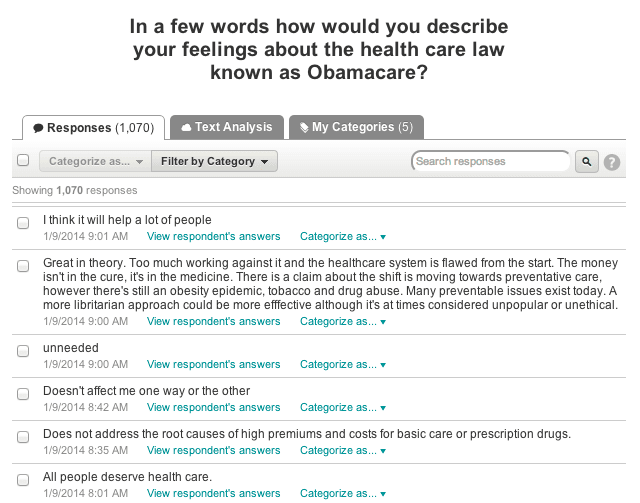
Here’s our open-ended question: “In brief, how would you describe your feelings about the health care law known as Obamacare?” And a peek at some of the responses we received:
One of the great things about open-ended questions? People aren’t limited to a predetermined set of possible answer choices, so you end up collecting a rich pool of genuine opinions about your survey subject from them. However, they also present an analytical challenge: just how do you make sense of all these unique answers?
For starters, thanks to our partnership with NVivo, you can easily import your SurveyMonkey data into the NVivo platform to analyse the text. Alternatively, you can do a basic analysis directly inside our Analyze tool and categorise the responses to provide not only a detailed picture of what people’s opinions are in their own words but also to know how many people feel that way. To use the Categorize feature, just tick the box next to each response in order to place it into a category. So, are you ready to become an open-ended expert?
Five tips to get you started
- Read through a couple of responses to get a sense of what people are saying. As always, know your data. By glancing at the images of the responses above, you’ve already completed the first step.
- Map out a few general categories to put each of the responses into. As you read the responses above, you can already see that people are pretty much divided into three camps, i.e. those who like the law, those who hate it and those who don’t have an opinion either way. So we created three categories: positive opinions about the law, negative opinions and neutral opinions.
- Create sub-categories underneath your general ones to provide even richer detail. As you move along and put responses in their respective buckets (positive, negative or neutral in this example), you’ll see some reoccurring themes cropping up within each general category. Group and tag those themes together to create new sub-categories. For example, we saw lots of respondents saying that the law was “socialistic”, so we created a sub-category for that underneath “negative feelings”. This extra information is totally optional, so if you don’t need this level of detail, feel free to skip to step 4.
- Double-check and recategorise. Go back and reread responses to make sure they fit properly into the categories that you’ve assigned them to. If you’ve added sub-categories along the way, you’ll be able to tag previous responses to the new sub-categories on this second look-through. Also, don’t be afraid to assign multiple categories to one response since open-ended comments often cover more than one category. But note that because each response can be assigned to multiple categories, your percentages may not add up to 100.
- Put a number on it! Congrats, you’ve finished! Click over to the My Categories tab in your question summary to see the percentages. After finishing our open-ended response analysis in our political survey, we found that of those we surveyed, 35% had positive things to say about the law, 55% had negative comments and 10% had neutral comments, which is similar to the US national opinion of the law.
Since we added extra sub-categories, we were able to paint a more detailed picture than if we had only looked at positive, negative and neutral as categories. For example, 10% of people mentioned that the law was a good idea but that due to the technical problems with the rollout of the Obamacare website, the law needed to be worked on.
That’s it for today, everyone. We hope these tips help out the next time you want to make sense of your open-ended responses. Please don’t be shy; let us know your thoughts!